
Prometheus and Alertmanager
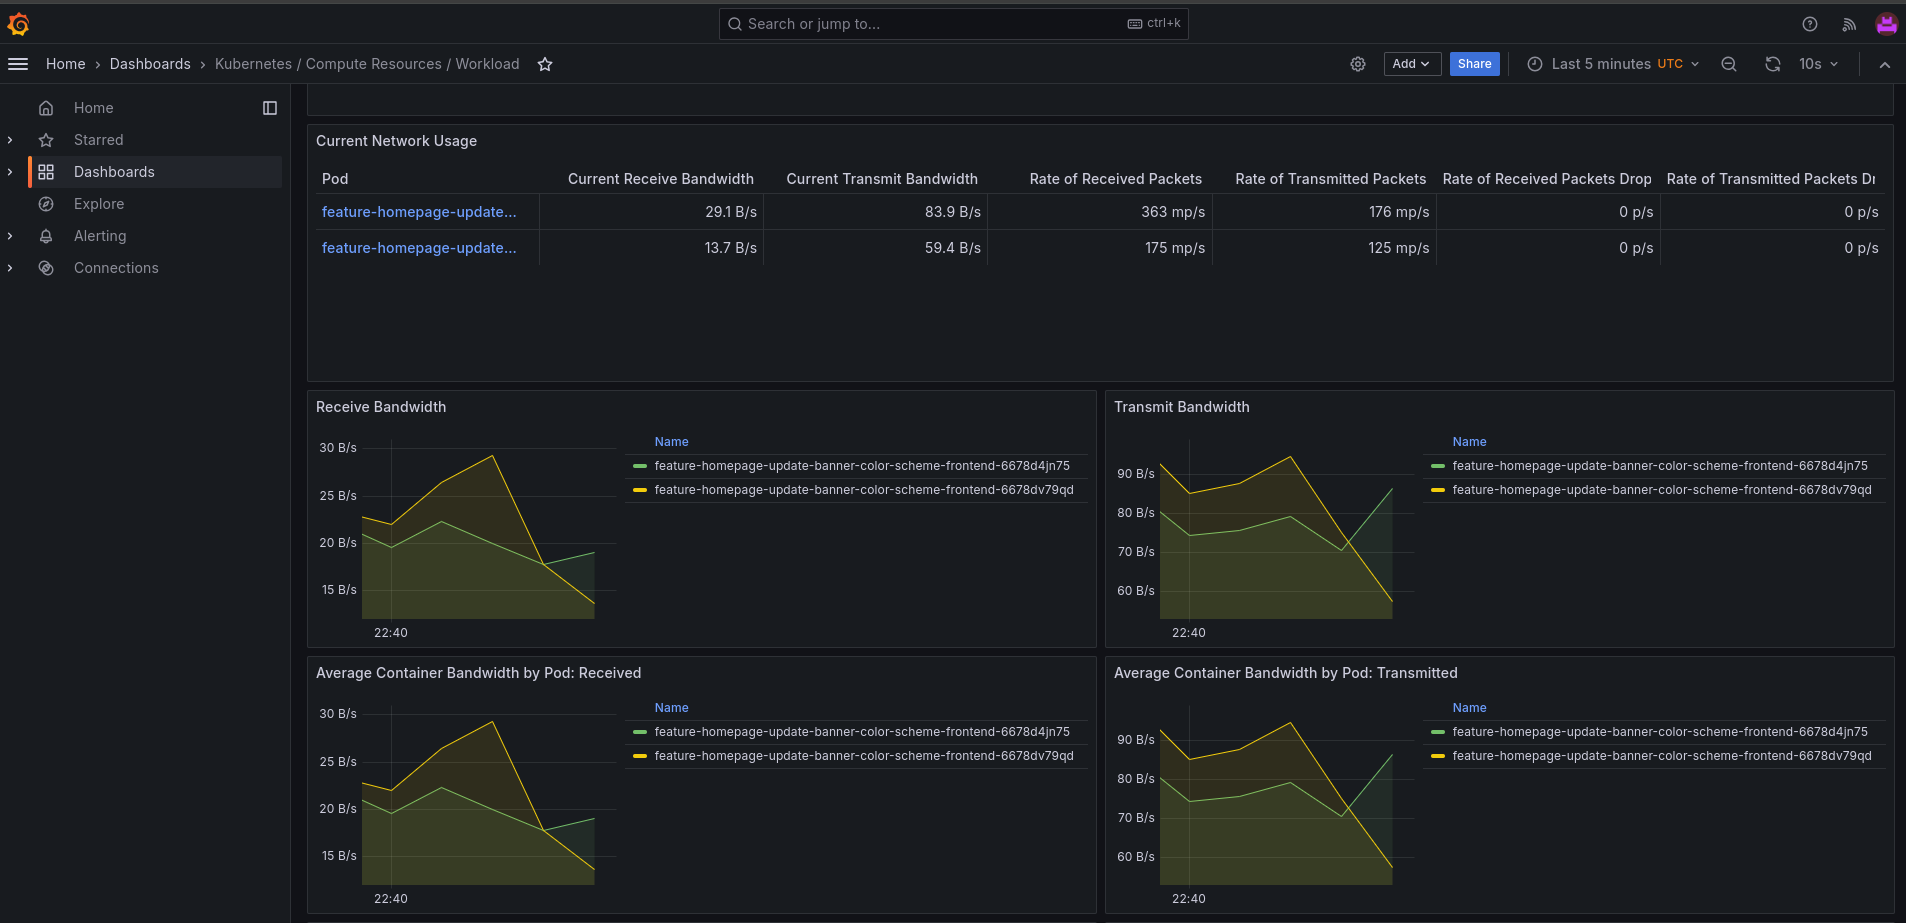
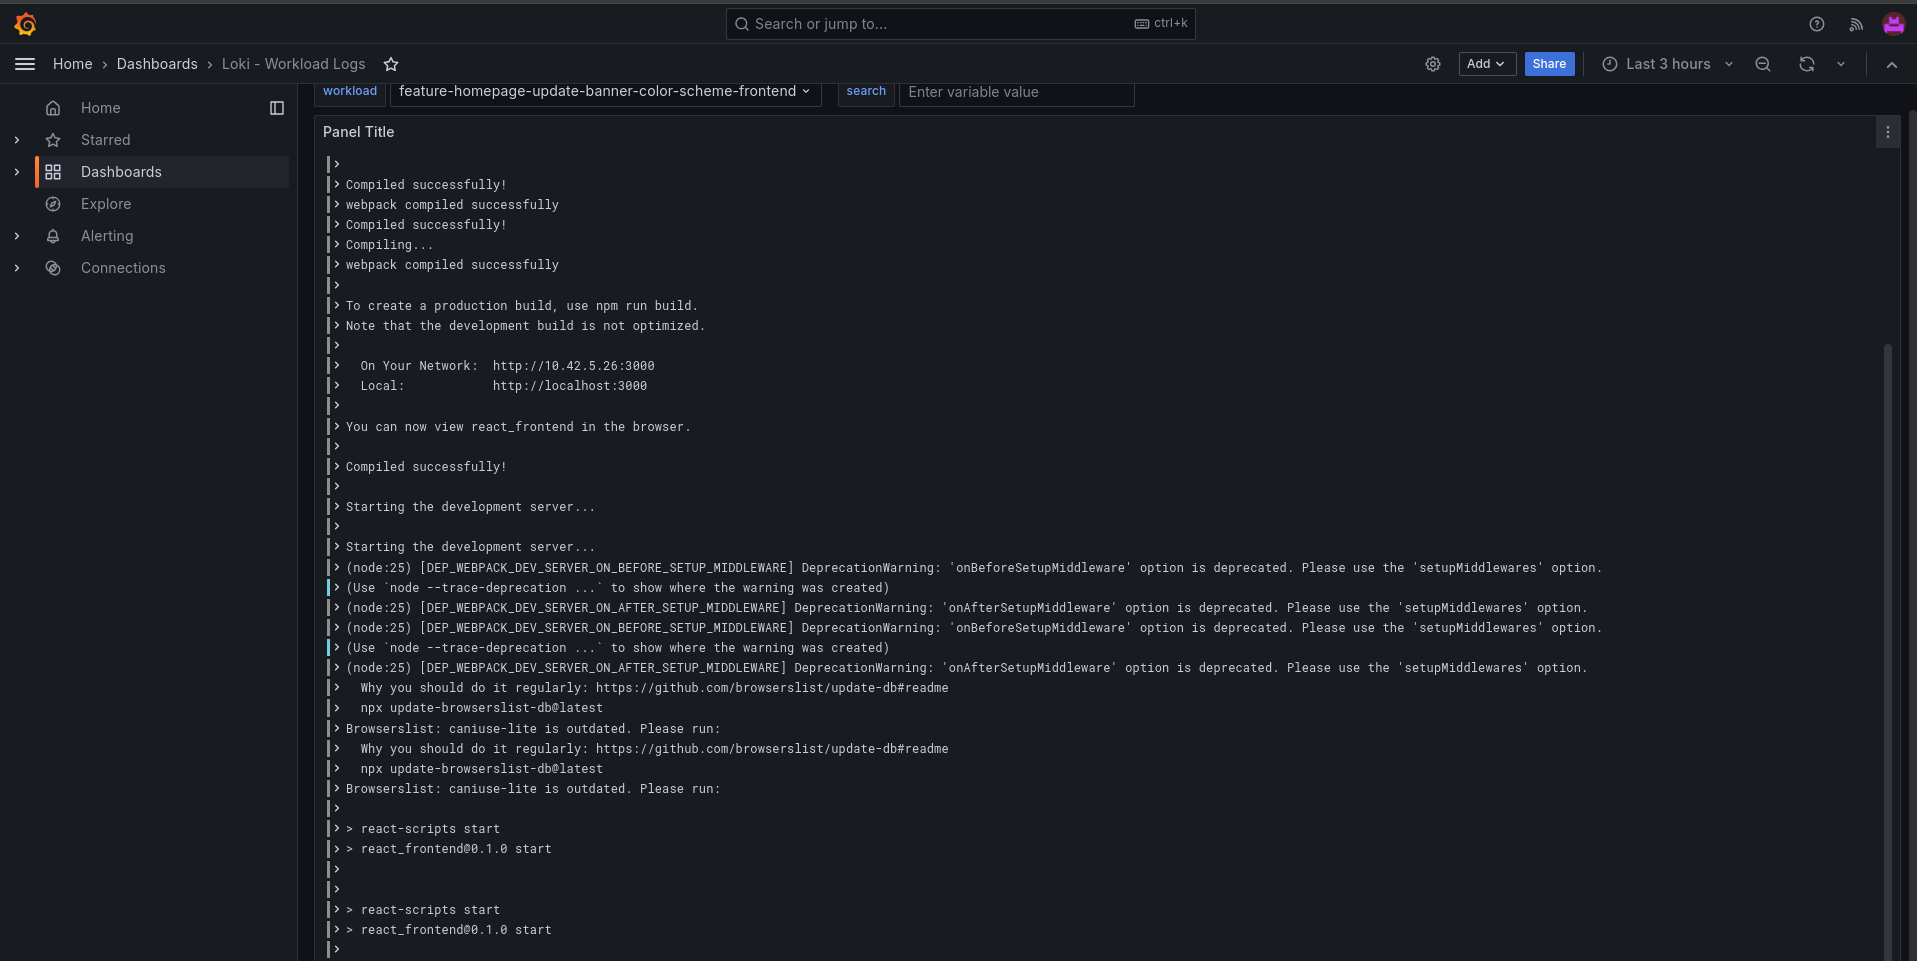
Prometheus collects metrics from the cluster, the platform components, and any application that exposes them through a ServiceMonitor or PodMonitor. Alertmanager sends the alerts. Both run with two replicas, and GlueOps adds alert rules for pods in a bad state, node CPU, memory and disk pressure, volumes near capacity, and high error rates. Teams can add their own alert rules on both metrics and logs.